
Olmstead, with Charts!
/
Information Bulletin #390
Steve Gold - June 20, 2014
This past Sunday was the 15th Anniversary of the U.S. Supreme Court decision in Olmstead vs. LC and EW ... or just Olmstead for short. It is an imperfect analogy, but not too far off to say that Olmstead is to people with disabilities what Brown vs. Board of Education is to racial segregation.
In its Olmstead decision, the Supreme Court applied the Americans with Disabilities Ac, an act of Congress in 1990, in a novel way. It found that "long term care" is a service, like any other, and that state governments that fund long term care must be sure to offer the service in the "most integrated settings", i.e., in peoples' own homes, not just nursing homes and institutions. It also affirmed that a person's choice of where and how to receive long term care services should play a role at least equal to the opinions of doctors and social workers. Finally, the decision ... and the President's Executive Order in 1999 which endorsed strengthened it ... underscored that states and localities might have to change their long term care programs and practices, even to the point of complete overhaul, in order to comply. "The way it's always been done" would no longer be an acceptable limitation, and "We don't offer that kind of service here" could no longer be an excuse.
Let's put it another way. If you, or your disabled child, or your aging parents, need help with everyday self-care every day, or several times a week, and your county or state says the only way they can get that help to leave their home and go into a nursing home, assisted living, group home, or other institutionalized facility ... that is a violation of their civil right to choose getting care in the manner and place they choose. It doesn't say they can't go into the "old folks' home" if they want to, but they can't be forced to just because nobody can or wants to figure out another way for them.
Most people, given the choice, would rather live in their own homes than nursing homes. With this Olmstead concept asserted at the highest level of U.S. law, the expectation was that more people would get care in their own homes and fewer in institutions.
A good way to measure how Olmstead has changed long term care for disabled people is to look at how Medicaid spending on long term care overall is divided among institutional care and community care ... between "facilities" with numbers of "beds", and care provided to people in their own homes and apartments. Steve Gold, one of the foremost advocates and policy analysts on long term care, recently published national and state-by-state data on community vs. institutional Medicaid spending, comparing 2000 with the latest complete data for 2012. Here, in chart form, is some of what he found:
Nationally
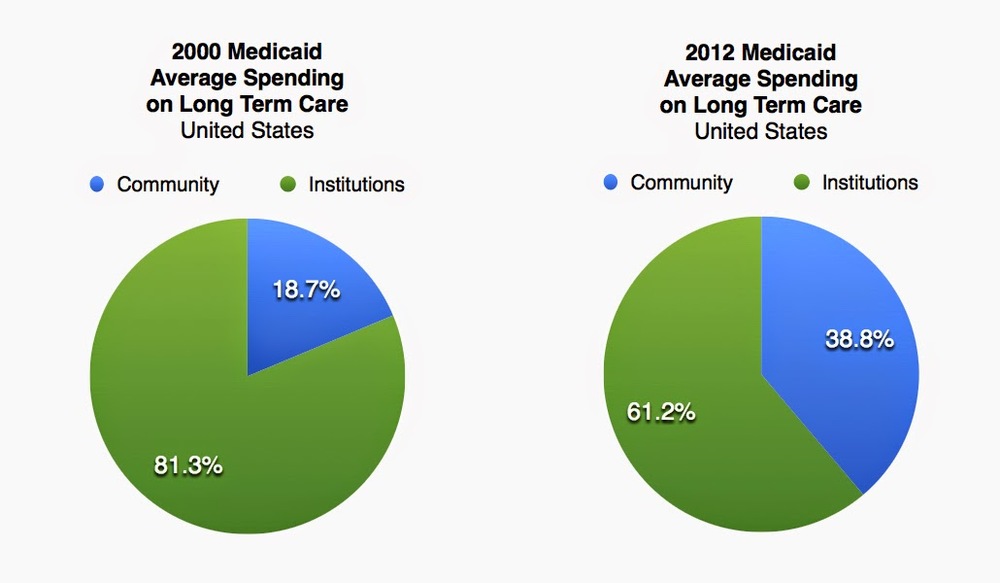
We still spend a good deal more than half of Medicaid long term care dollars on institutional care than we do on providing care in peoples’ own homes, but there has been a 20.1% shift towards community-based care. That’s a pretty big shift that almost certainly is the result of policy changes and peoples’ choices, not changes in peoples’ physical needs. In other words, it’s a shift that has occurred because we wanted it to occur, and made it happen.
States

There is a vast difference among the 50 states. It’s interesting to note that the two states at the opposite ends of the spectrum are the neighboring states of North Dakota and Minnesota. North Dakota is still much more invested in institutional care, while in Minnesota, institutional care is still substantial, but also a clear second to community services, a still a rarity when in most states, institutional care still outweighs community services. Finally, it’s encouraging to see that while some states have made only modest changes, and others have a long way to go, every state has improved it’s balance in favor of community care.
Again, these different numbers can’t be driven by differences in need … disabled and elderly people most likely have the same kinds of needs and preferences in both states. Such a huge difference in spending must be due to different policies, and policies can be changed.
What it means for people is that more of the people who need long term care … children, young disabled adults, and people with disabilities from age … now are able to get it in their own homes, and fewer wind up in nursing homes or other institutions against their wishes. That is progress, and it’s far more dramatic than any chart can fully demonstrate.